Filters
Narrow down your data with the filters at the top:| Filter | Options |
|---|---|
| Date Range | Select start and end dates |
| Filter by Agent | View specific agent’s calls |
| Filter by Campaign | View specific campaign’s calls |
| Filter by Call | Filter by call type or status |
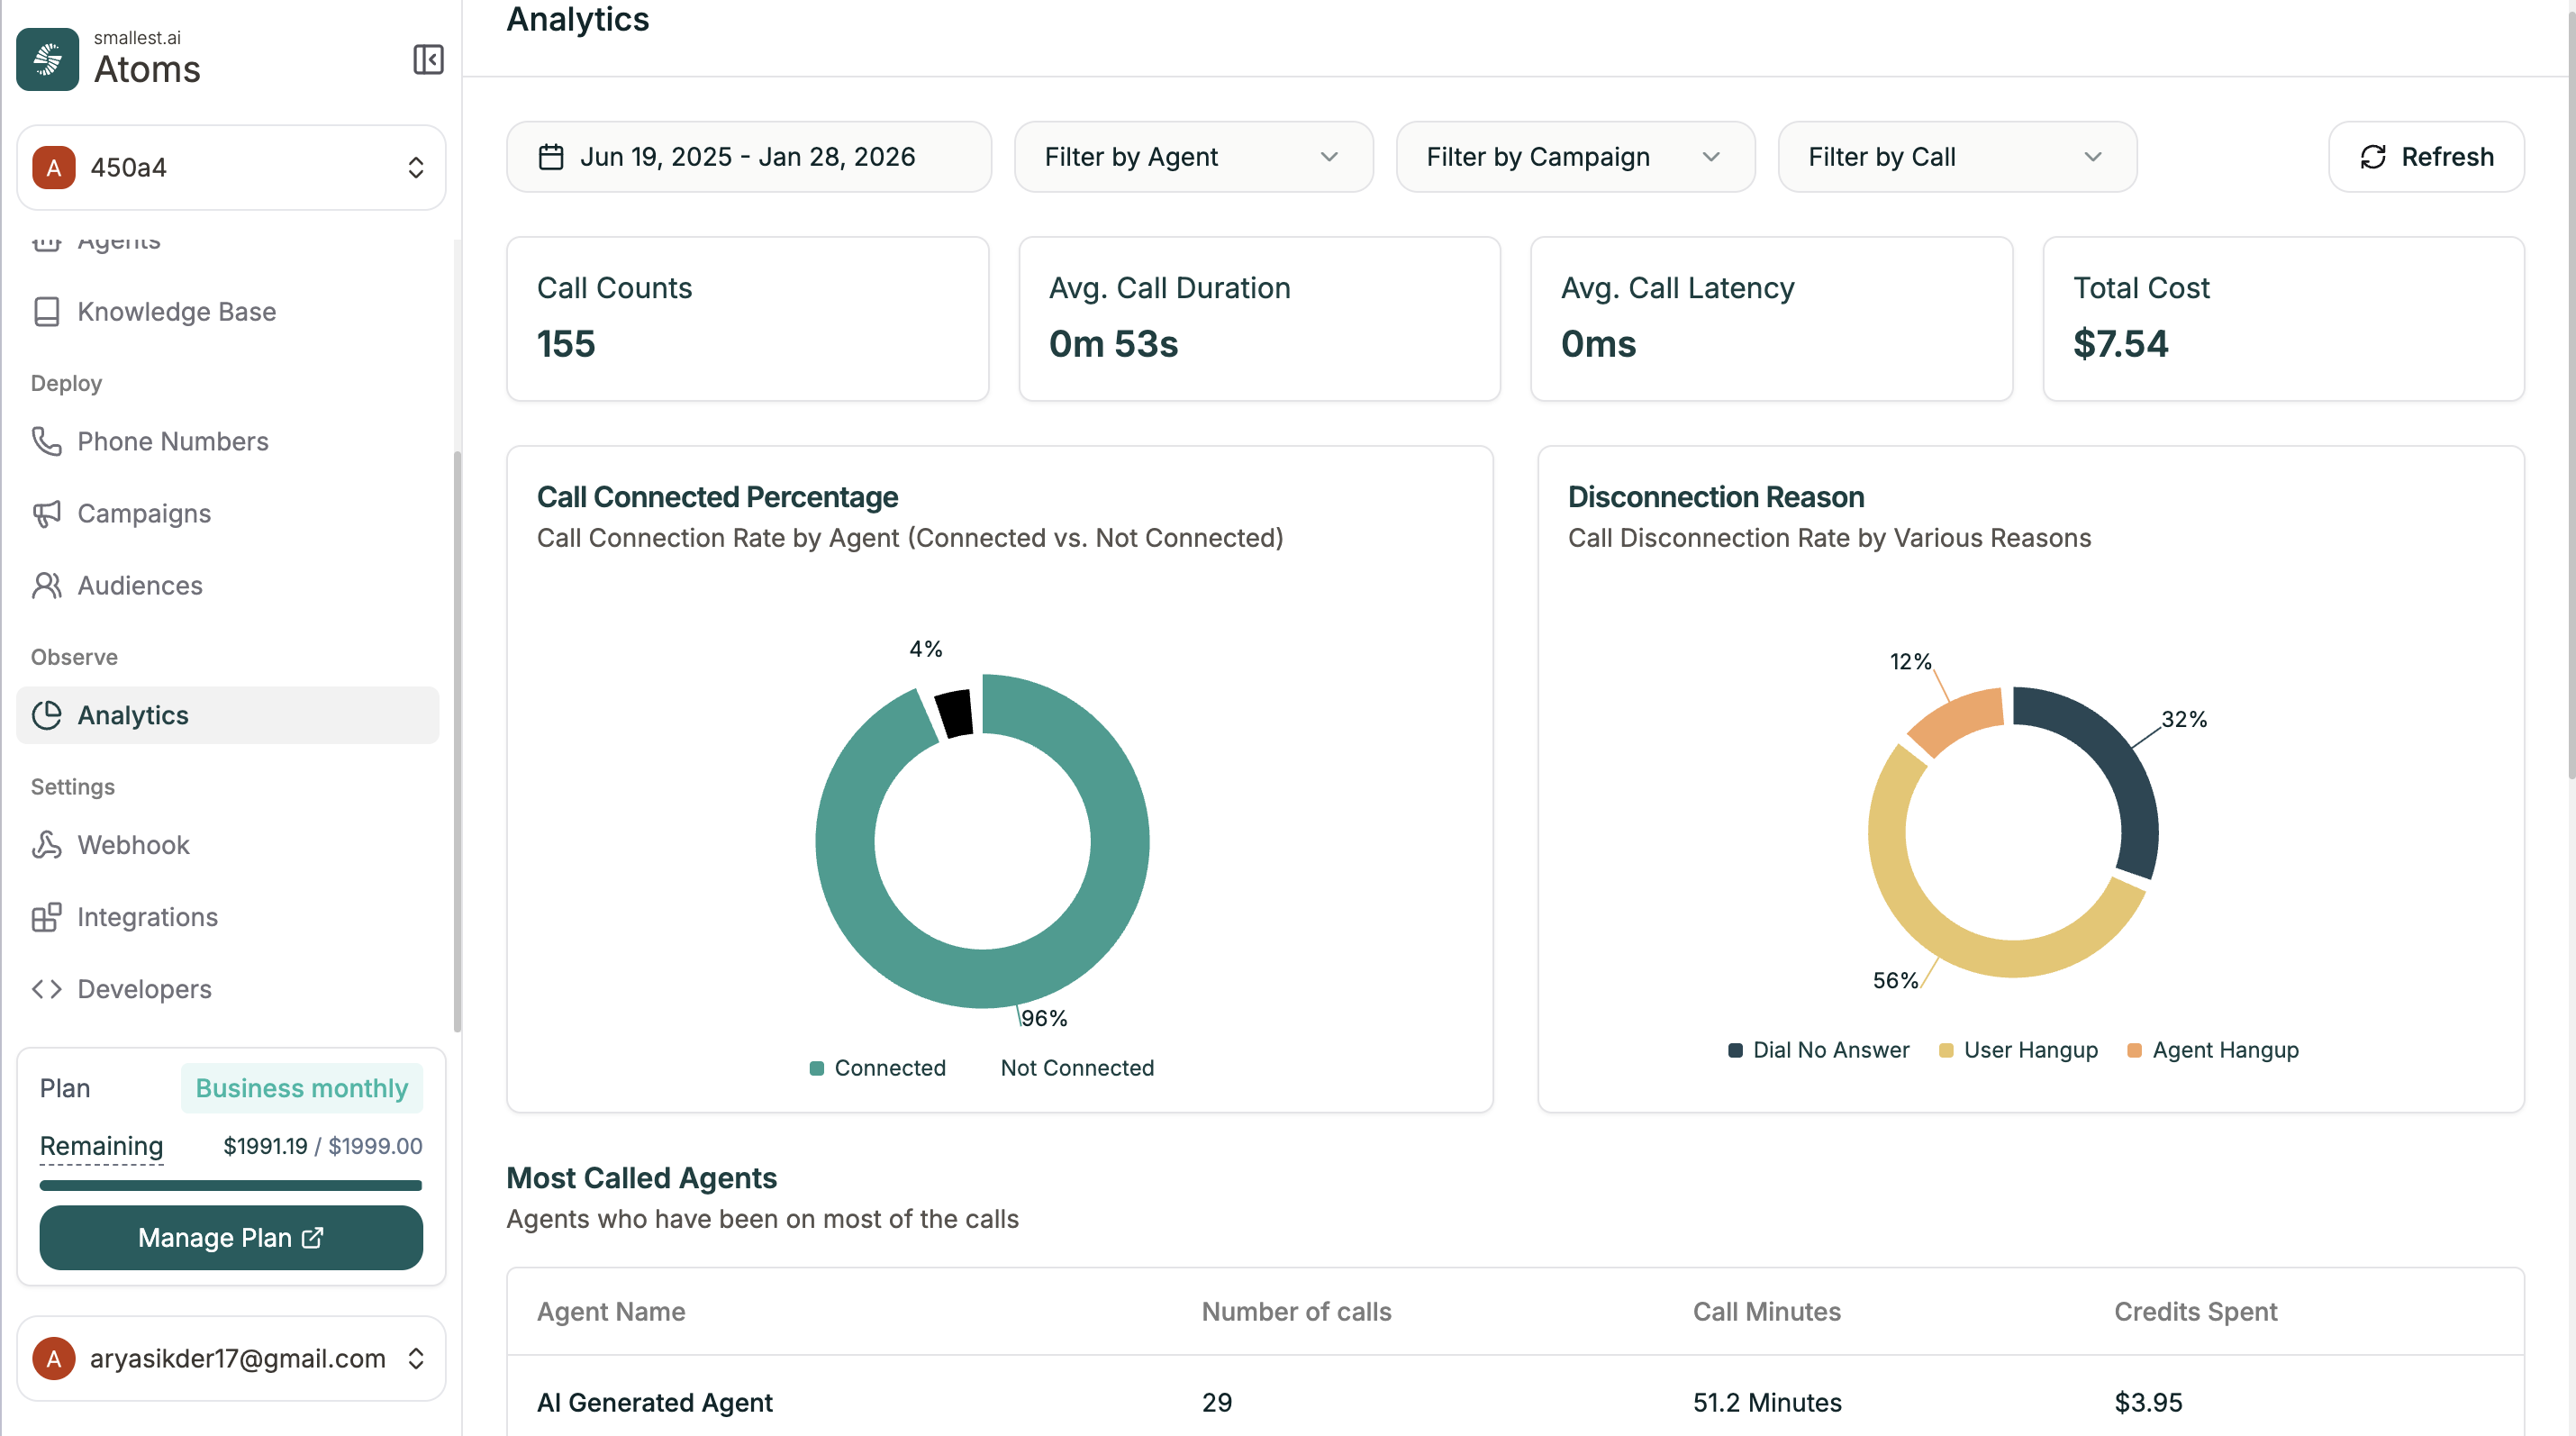
Summary Cards
Quick metrics at the top of the dashboard:| Metric | Description |
|---|---|
| Call Counts | Total number of calls |
| Avg. Call Duration | Average length of calls |
| Avg. Call Latency | Average response time |
| Total Cost | Credits spent on calls |
Charts
Call Connected Percentage
Pie chart showing the connection rate by agent—how many calls connected vs. didn’t connect.Disconnection Reason
Breakdown of why calls ended:- Dial No Answer — Contact didn’t pick up
- User Hangup — Contact ended the call
- Agent Hangup — Agent ended the call
Most Called Agents
Table showing which agents handled the most calls:| Column | Description |
|---|---|
| Agent Name | The agent |
| Number of calls | Total calls handled |
| Call Minutes | Total talk time |
| Credits Spent | Cost for this agent |
Related
Conversation Logs
Drill into individual call details
Campaigns
View campaign-specific analytics